Interacting with HighCharts Charts
HighCharts javascript libraries support the creation of interactive charts. Here are some of the HighCharts features implemented with the charts on this site:
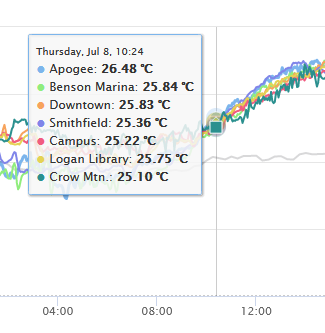
Data -- Mouse over the chart to see specific data. If data was collected at different intervals, only certain data may be available at particular points in time.
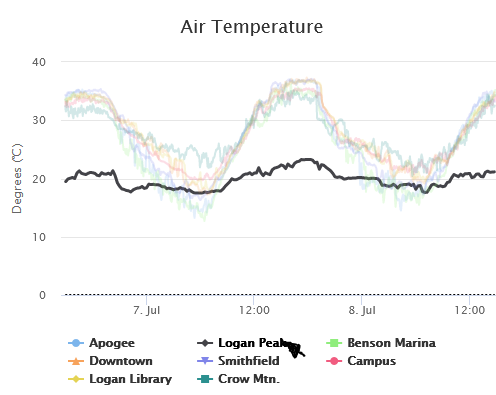
Legends -- At the bottom of the charts are the data legends. Mouse over a legend to see that specific data set. Click on a legend to remove that data from the chart. Click again to add it back in.
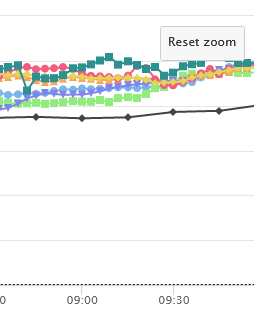
Zoom -- Click and drag within the chart to zoom into the data. Repeat the process within the zoomed data to zoom in even farther. Click on the Reset Zoom button to restore to the original chart level.